 SEEPLORE
Air pressure and dew point are hard to grasp from a single textbook diagram. They're about air, and you can't see air. This post is a guide to using the seeplore title Earth's Environment in Pictures in science class or for studying at home: which scenes to show and in what order, what to ask students while they watch, and how to review alone afterwards.
Six of the seventeen scenes for class
The title starts in space, looking at the Sun and Earth, then zooms in ten times at each step all the way down to a single raindrop, and back out to space — seventeen scenes in all. It would be great to show the whole thing, but lessons are short. The six scenes in the middle fit straight into middle-school units on air pressure and wind, and on clouds, rain and snow: pressure, low pressure, high pressure and wind in Chapter 3, then clouds and rain-or-snow in Chapter 4.
Every scene has its own address, so you can open them ahead of time. Add #pressure/1 to the end of the address and the pressure scene opens directly; the others work the same way with low, high, wind, cloud and rainsnow. Bookmark the pressure scene, and during class you only need the left and right arrow keys to move between scenes.
Start pressure with a bag of chips
The pressure scene shows a blue column rising from the ground into the sky, with the pressure marked at each height. At sea level it's 1,013 hPa; at 5.5 km it's 505 hPa, about half. The higher you go, the less air is left above your head.
Try opening with a question instead of the numbers: "Why does a bag of chips puff up when you take it up a mountain?" The scene's card uses the same example. The air inside the bag hasn't changed — the air outside is pressing less. Follow up with "So why don't we feel the air pressing on us?" and you slide naturally into the card's "Why?" section: our bodies push outward with the same force.
These numbers come from the International Standard Atmosphere, which assumes average weather. It's worth pointing out that real pressure changes from day to day.
Follow the arrow colors and you can see the wind
The low-pressure, high-pressure and wind scenes share the same seaside model: a clear summer day where land meets sea. Land warms up faster than water, so the air above it rises, like the red arrows. With air leaving upward, the ground level over land becomes low pressure. Over the sea, cool air sinks and piles up, like the blue arrows, making high pressure.
Pause here and ask: "So which way will the wind blow near the ground?" Once students have picked an answer, move to the wind scene: white arrows flow from the sea toward the land. High up, the air flows the other way, making one big loop. This daytime breeze from the sea is a sea breeze, and the card also explains why it reverses at night, when the land cools faster.
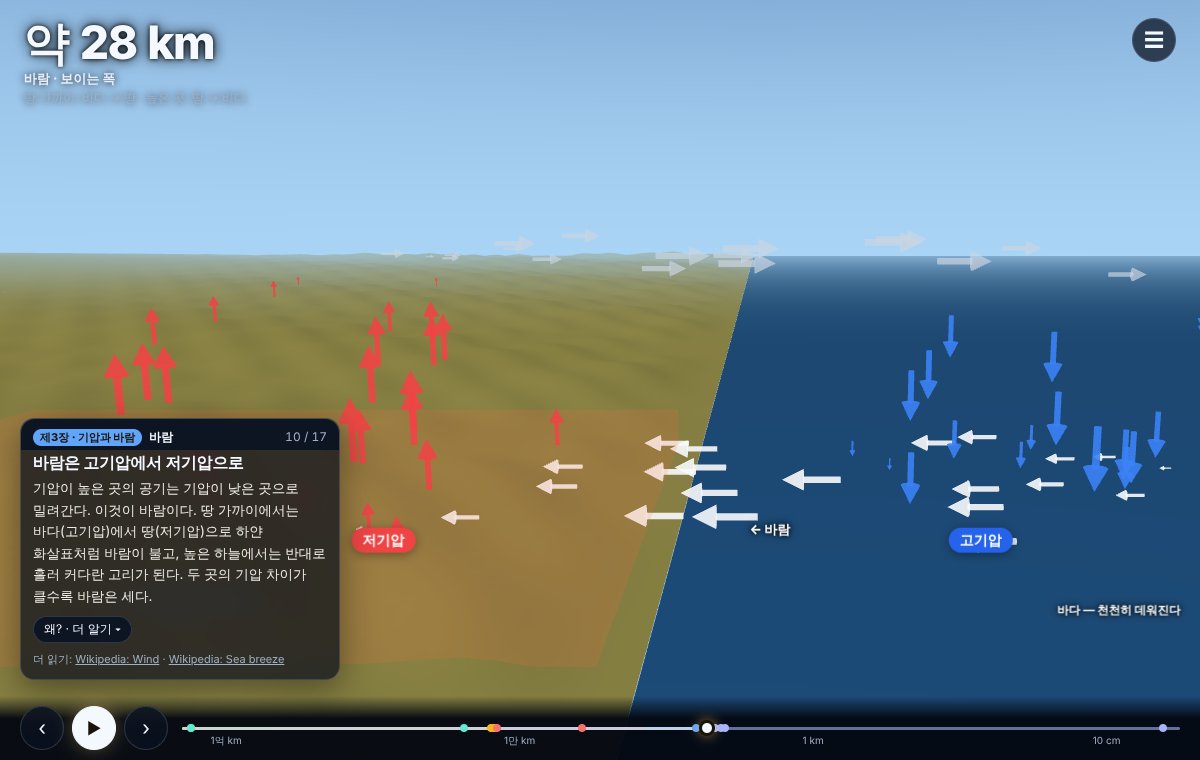
One thing to add: the highs and lows on this screen are a small model to show the idea. The highs and lows on a weather map are far bigger — hundreds to thousands of kilometers across. Heights in the land model are also stretched 2.5 times.
Why are cloud bottoms flat?
Some days, puffy clouds all have bottoms as flat as if drawn with a ruler. The cloud scene explains this with a single parcel of air. A parcel at 25°C rises from the ground, and its dew point is 15°C. The dew point is the temperature at which water vapor starts turning into droplets — think of the droplets that form on the outside of a cold drink.
On screen, the parcel cools as it rises and reaches its dew point at about 1.3 km, where the cloud begins. The title calculates the cloud base as about 125 m for every 1°C of difference between temperature and dew point. The difference is 10°C, so that's 1,250 m, shown rounded as about 1.3 km. It's a simple textbook rule of thumb, so students can do the multiplication themselves and check it against the screen.
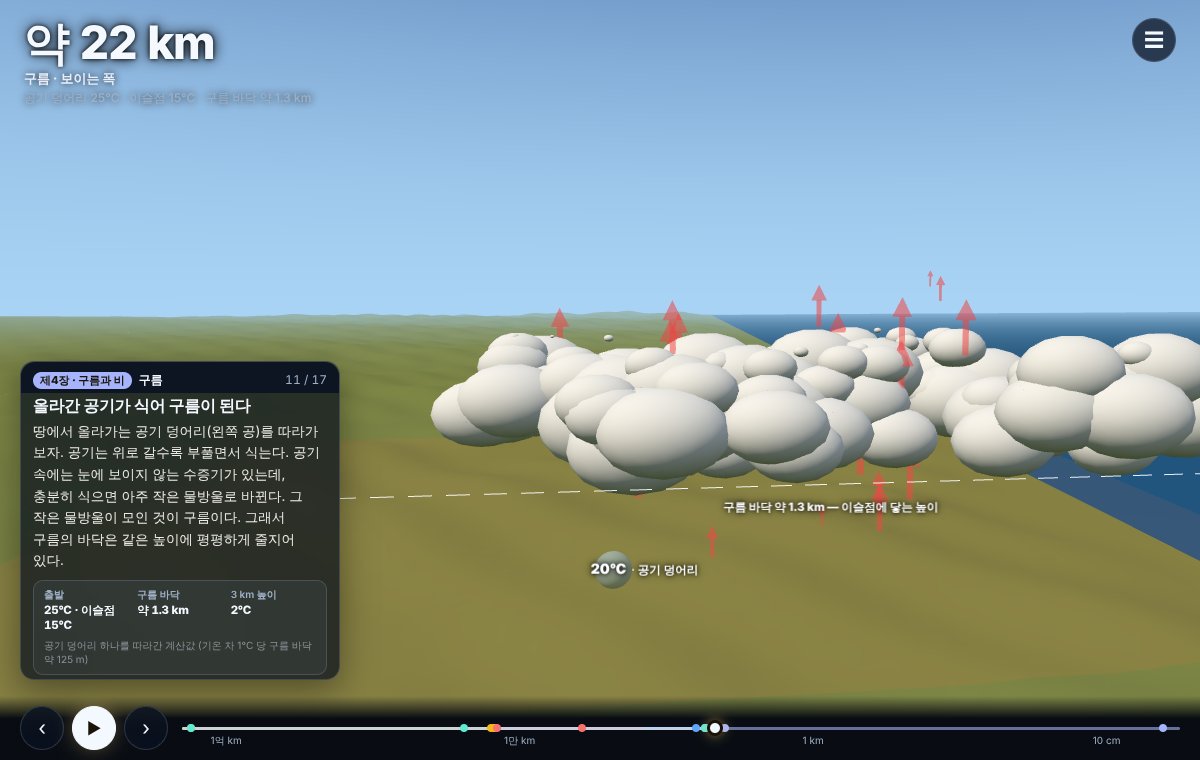
Then ask: "If the gap between temperature and dew point were bigger, would the cloud base be higher or lower?" The card's "More" section also explains that before a cloud forms, rising air cools by about 10°C per kilometer, and after it forms, by only about 6°C — because water releases heat as droplets form. With a fast-moving class, you can go that far.
Rain or snow? Make them predict first
This is the one scene of the six where students can get hands-on. The rain-and-snow scene has a slider for the ground temperature, from −6°C to 12°C. Move it and a white sheet showing the 0°C height rises or falls, and what's falling switches between rain, sleet and snow.
The trick is to ask for a prediction before anyone touches the slider: "If the ground is 2°C, what falls?" At 2°C, the 0°C height drops to about 310 m and you get sleet. At 6°C it's about 920 m, so snowflakes melt on the way down and land as rain. At −2°C, everything down to the ground is below freezing, so the snow arrives as snow.
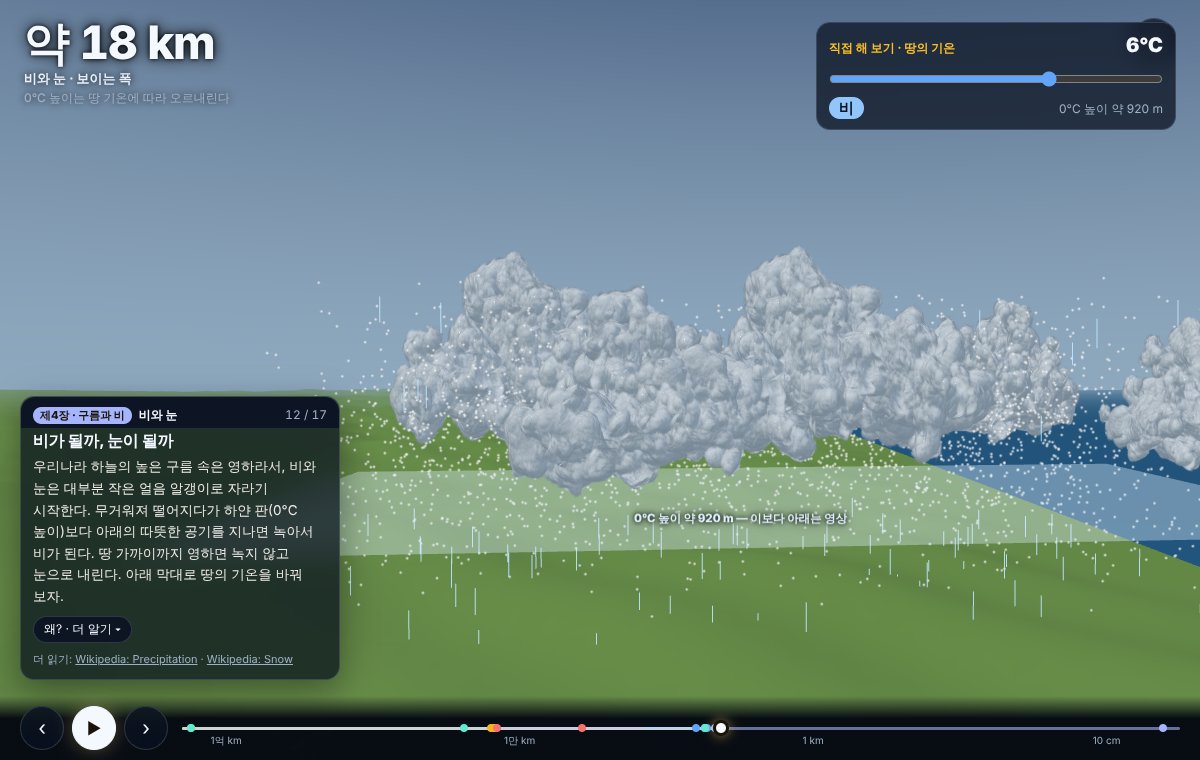
The key idea is in the card's "Why?" section: whether it rains or snows is decided not by the cloud, but by the temperature of the air below it. The boundaries on screen are approximate, though. As the card notes, when the air is very dry it can snow even with the ground a little above 0°C.
Reviewing at home: documentary mode
For parents, I'd suggest watching it from the start together with your child. Open the ☰ menu and tap "Documentary mode" at the bottom, and narration and subtitles play from the current scene to the end. Each scene takes about 20–30 seconds, so it's easy to sit through. The slider isn't available in documentary mode; instead, the rain-and-snow scene lowers the ground temperature from 6°C to −2°C on its own, and you watch the rain turn into snow.
Afterwards, pick one "Why? · More" section from a card and have your child explain it in their own words. Explaining to someone else quickly shows where the gaps are.
If you'd like to take air pressure a step further, try How 250 Tonnes Fly from the same series. It calculates the airflow around a wing and shows it, so you can see how much force invisible air can produce.